Key Performance Indicators (KPI)
Key Performance Indicators (KPIs) can be used to monitor your progress towards your objectives, e.g. compare the scheduled visits per account to the actual visits over a particular time period (quarter, year).
When calculating the KPIs, the account hierarchy is taken into account to prevent data from being counted multiple times. For example - if a field rep visits several persons in a department or several departments of an account, such a visit is only counted once at the department and account level respectively.
Aurea CRM differentiates between the following types of KPIs:
- Account-related KPIs, used to evaluate data such as specialties, brands, target visits and ABC classification per quarter and per year.
- Person-related KPIs, used in addition to account-related KPIs allow you to evaluate the contact person’s role, level, specialty, prescription potential, loyalty and product opinions.
All KPIs defined for an account and persons linked to the account are displayed in the KPI node (Account-related and Person-related tabs).
Person-related KPIs are also displayed in the person tree (Roles node, select the account to view the KPIs on the KPI tab) as well as in the account tree (Persons node, select the desired person to view the KPIs on the KPI tab).
The number of activities of the Type "Visit" with the Status "Completed" is automatically entered in the Actual visits/period field of the KPI record.
The start page for sales reps includes an overview of KPIs including the actual and target number of visits for the current period.
Adding KPIs for Accounts and Persons
To add a KPI:
- Switch to the desired account/person.
- Click on the KPI node in the tree for accounts or open the Roles tab for persons, select the desired account and switch to the KPI tab.
- Click on
 (New) in the results list.
 - Enter data such as the Year, the Period, the Business area, the Specialty, Brand etc.
- You can enter further details in the Customer Classification area, such as the Potential (current and target), the Intimacy (actual and target values) etc.
- Save the record.
Adding Global KPIs
To add a global KPI:
- Select
 (Sales) > KPI (Global).
 - Click on
 (New) in the results list.
 - Enter data such as the Country, Year, Period, Target visits/year, Actual visits/year etc.
- Enter the KPI type and Account type and/or the Specialty. The KPI type determines whether KPI records are generated for accounts or persons.
- Save the record.
- Click on Fill Targets. A To-Do is added that is used to
generate the KPI records automatically.Note: KPI records are only added automatically if an account manager has been entered for matching persons or accounts, see Territory Management – LSI.Note: To change the target number of visits in the generated KPI records, edit the global KPI record and click on Fill Targets again.Note: Depending on the configuration defined by your administrator, the values may be transferred to customer records at a later time, e.g. during the night to reduce the impact on the system’s performance.
KPI Report
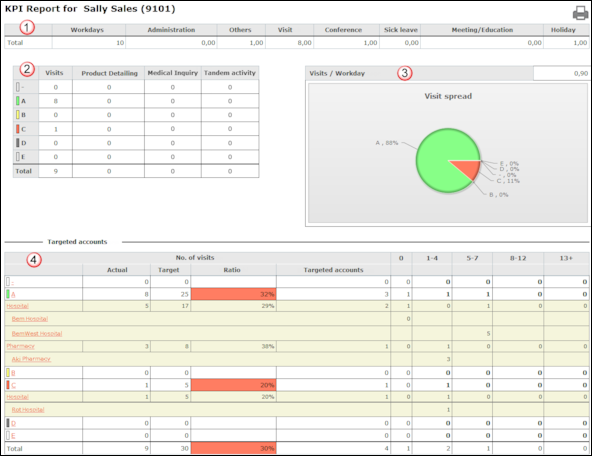
The KPI report for field reps display an overview of how customer calls are distributed in comparison to the target numbers defined in the KPIs.
Depending on your business area, calls are either broken down by account type (OTC) or the specialty of persons (Rx).
Select
 (Reporting) > KPI Report to generate
the report.
Select  (Print) to print the report.
Example (OTC):

|
|
Displays the work you have entered and your work days for the current year up to the current date. This data is taken from the entries in the occupation report, see Occupation Reporting – LSI. |
|
|
Displays the number of completed visits broken down by the classification defined in the KPI. This table only displays visits during the current period (the Period defined in the KPI record). |
|
|
Displays a pie chart breaking down the visits over the current period by classification. The number at the top right indicates the average number of visits per work day. |
|
|
Displays details on visits completed during the current period. Click on - (unclassified), A, B, C etc. to view additional details. The Target column displays the target visits entered in the KPI records for the period. The Ratio column displays the percentage of the target that has been reached (Actual / Target). The 0, 1-4, 5-7 etc. columns display the number of companies visited that often. Visits are then broken down by account type (OTC) or specialty (Rc). The figure displayed in this column for a company/person indicates the actual number of visits for that person. The Total row at the bottom of the table displays the sum totals. |
- You must be assigned to a Business area, see Managing Reps.
- You need to be entered as the account manager of companies/persons, see Territory Management – LSI.
- KPI records containing a suitable Classification must have been added for companies/persons, see Key Performance Indicators (KPI).
- Your Business area must be the same as that entered in activities and the KPI record.
- You need to have entered your activities and occupations (using the occupation reporting function or in the calendar). Activities added to the calendar need to first be transferred to the occupation report, see Occupation Reporting – LSI and Phase 2 - Edit.


