Key Performance Indicators Dashboard (Enterprise CRM)
The KPI dashboard provides a quick measure of your business metrics primarily focusing on customer development and management.
It shows the current state of your sales for existing and new customers. This would be very useful in monitoring open calls, new customers of interest and other related information without having to be informed by e-mail.
The following screenshot shows the KPI dashboard:
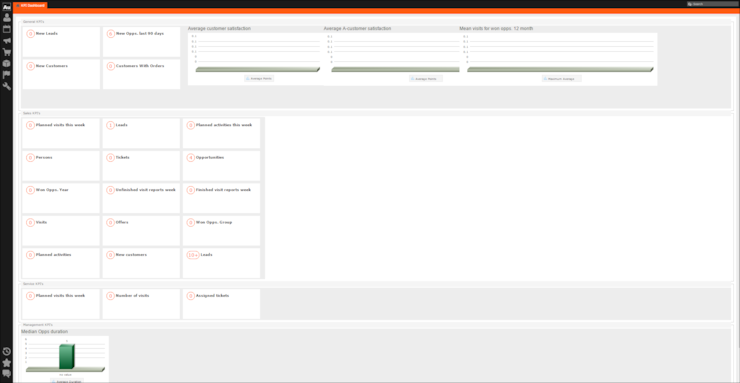
You can find the following metrics displayed in the KPI dashboard under various categories:
|
KPI Category |
Type |
Name on the dashboard |
Description |
|---|---|---|---|
|
General |
Query |
New leads |
Number of new potential customers (leads) developed per 90 days. |
|
General |
Query |
New Opps. last 90 days |
Number of new opportunities in the last 90 days. |
|
General |
Query |
New Customers |
Number of new customers (have placed 1 order) in the last 90 days. |
|
General |
Query |
Customers With Orders |
Number of customers have placed total orders greater than X in the last 12 months. Note: The size of an order in the query is defined by your management. Contact
your administrator to reset the order size according to your
requirement.
|
|
General |
3D Bar |
Average Customer Satisfaction |
Average Customer satisfaction score of all customers this year and value from the previous year (measured per calendar year). |
|
General |
3D Bar |
Average A-customer satisfaction |
Average customer satisfaction score in A customers and the value from the previous year. |
|
General |
3D Bar |
Mean visits for won opps. 12 month |
Mean number of visits for the opportunities won in the last 12 months. |
|
Sales Rep |
Query |
Planned visits this week |
Number of visits planned for this week for the current sales representative. |
|
Sales Rep |
Query |
Leads |
Number of leads (potential customers) for the current sales representative. |
|
Sales Rep |
Query |
Planned activities this week |
Number of visits planned for this week for the current sales representative. |
|
Sales Rep |
Query |
Persons |
Number of new persons planned for the current sales representative. |
|
Sales Rep |
Query |
Tickets |
Number of tickets for the current sales representative. |
|
Sales Rep |
Query |
Opportunities |
Number of opportunities for the current sales representative. |
|
Sales Rep |
Query |
Won Opps. Year |
Number of won opportunities for this year for the current sales representative. |
|
Sales Rep |
Query |
Unfinished visit reports week |
Number of unfinished visit reports for this week for the current sales representative. |
|
Sales Rep |
Query |
Finished visit reports week |
Number of finished visit reports this week for the current sales representative. |
|
Sales Rep |
Query |
Visits |
Number of visits planned for the current sales representative. |
|
Sales Rep |
Query |
Offers |
Number of offers for the current sales representative. |
|
Sales Rep |
Query |
Won Opps. Group |
Number of won opportunities for rep's sales team (org group) can be used to compared to other teams (gamification). |
|
Sales Rep |
Query |
Planned activities |
Number of appointments planned for the current sales representative. |
|
Sales Rep |
Query |
New customers |
Number of new customers for the current sales representative. |
|
Sales Rep |
Query |
Leads |
Number of leads (potential customers) for the current sales representative. |
|
Service Rep |
Query |
Planned visits this week |
Number of visits planned for this week. |
|
Service Rep |
Query |
Number of visits |
Number of visits done by the service representative. |
|
Service Rep |
Query |
Assigned tickets |
Number of assigned tickets. |
|
Management |
3D Bar |
Median Opps Duration |
Graph depicting the median of the duration of each opportunity. |