Agency email report
Administrators for agencies with sub-accounts can view recent email activity for some or all of those sub-accounts in one place--the Agency Email Report.
The report shows the Emails Sent, Deliverability, Open Rate and Clickthrough Rate metrics for all mailings in the selected data range in both graph and list format.
You can export all data in CSV format for analysis and presentation.
Opening the agency email report
- On the navigation bar, click Email Marketing > Reports > Agency Email.
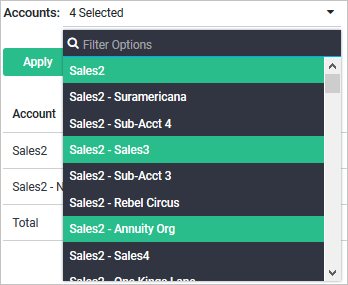
- In the Accounts field, select the agencies for which you want to view the report.
- Optionally, you can select the date range in Date From and Date To fields to make your report more specific.
- Optionally, you can enable or disable the graph view by clicking on
 .
.
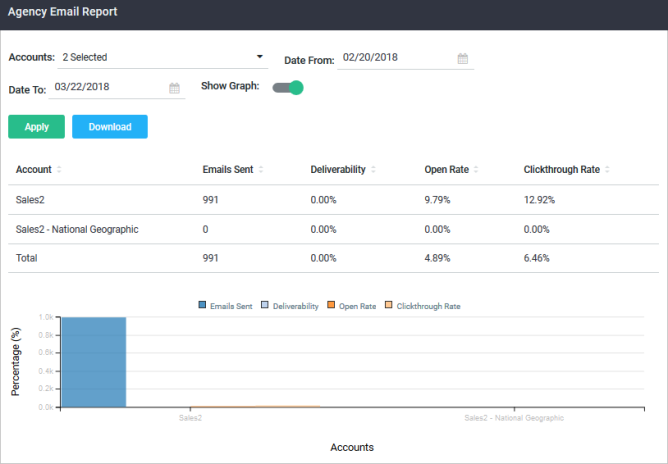
Graph
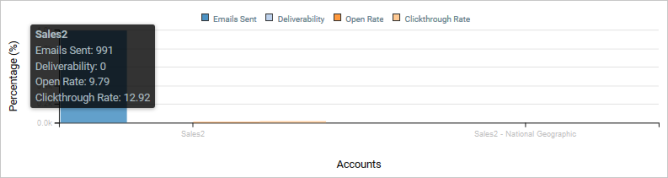
Each bar in the graph represents a metric. The legend on the right shows which metric each bar represents.
- To view more details for a bar, move the pointer over the bar.
- To show or hide the graph, click .
- To learn more about how each metric is calculated, point at the metric in the legend.
Metrics table
The metrics table at the bottom of the screen shows the metrics in table format.
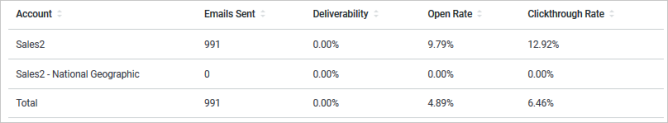
- Emails Sent column displays the total number of emails sent.
- Deliverability and Clickthrough Rate columns display the weighted average for each category and weighted average total for each column, based on the number of emails sent.
To export the metrics table as a CSV file, open or save it in Microsoft Excel or any program that supports the CSV format.
- Click the
 button located above the table.
- Follow the instructions in the dialog to save or open the report.
Viewing the Report for a different date range
- Click the Date drop-down list in the upper right corner.
- Select the date range you want.
Viewing the report for specific sub-accounts
Click the Accounts drop-down list and select the desired agencies.