Timeline Analysis
The timeline analysis allows you to display data over intervals (time or numerical).
The following types of display are available:
- By row: Data in each row is accumulated; i.e. each row corresponds to the data in an aggregation. The aggregation can be based on the parent info area or a criterion.
- Single display: Individual records are displayed.
Displaying by Rows
When displaying data by row, several records are displayed in the same line. If this analysis is applied to child info areas (specified in the transfer fields format), this type of analysis is required. It is optional for analyses where the transfer fields are defined at the top-most level.
To display the opportunities (or activities etc.) per company on the timeline:
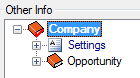
- Define transfer fields for the Company and
Opportunity info areas.
- Define the analysis as a Time axis.
- Enter the field to be displayed on the time axis in the Levels
tab, and the info area in which the drill-through data are displayed.
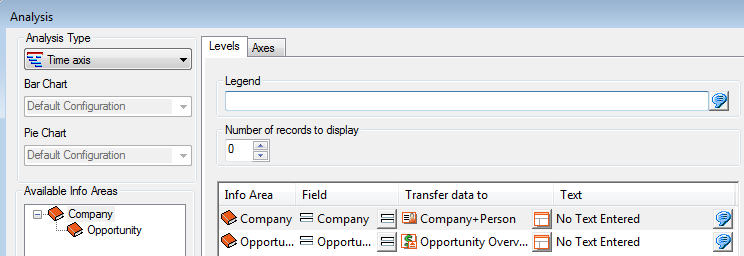
- Switch to the Axes tab and add a new line with three
fields:
- Start: You can choose either numerical or date fields from the current info area and all dependent info areas (e.g. the opportunity's realization date).
- End: You can choose fields of the same type from the same info area as the first field you selected (e.g. the opportunity's completion date).
- Aggregation: Here you can choose fields from the same info area as the previous fields or leave the field empty
- Click on
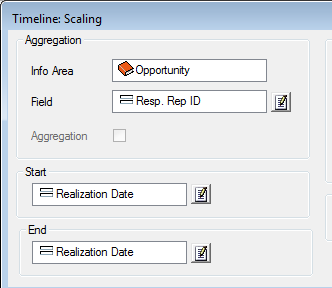
 (Scaling) to display the
Timeline: Scaling dialog box.
(Scaling) to display the
Timeline: Scaling dialog box.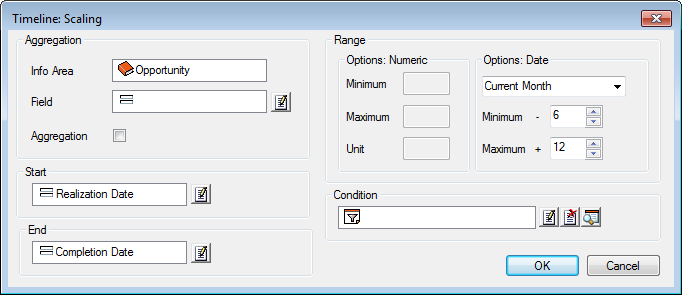
The Start and End fields you have selected are displayed. You can change the selection here, and determine whether the values are aggregated.
- Use the pane to the right to determine the range. The available options depend on whether you have selected numeric or date fields. Define e.g. that the analysis includes data from the last 6 and next 12 months.
- Save the analysis and execute it.
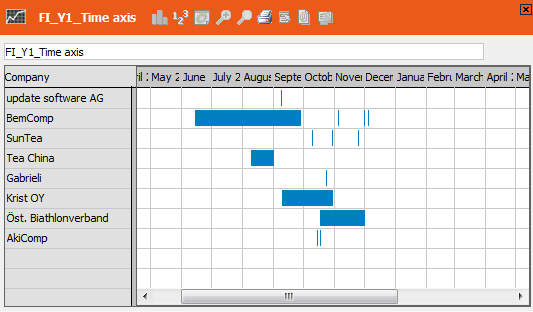
Each line contains the opportunities for the company. The cells are divided according to the unit you selected in the analysis, and the bars span the length of the opportunity.
- If you enable the Aggregation option in the analysis format, the result changes (the first of all dates is taken as the start date; the latest of all the dates as the end date).
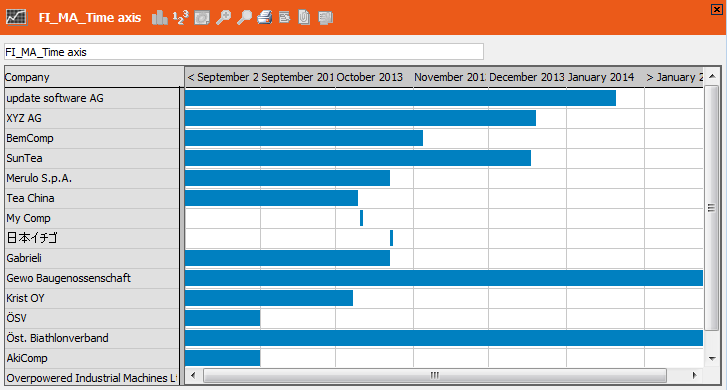
Example: Activity history for a company
The following example displays the activities for each company according to their date. In the timeline scaling select only starts on and ends on and leave the aggregation field empty.
With the Aggregation option active the result is as follows:
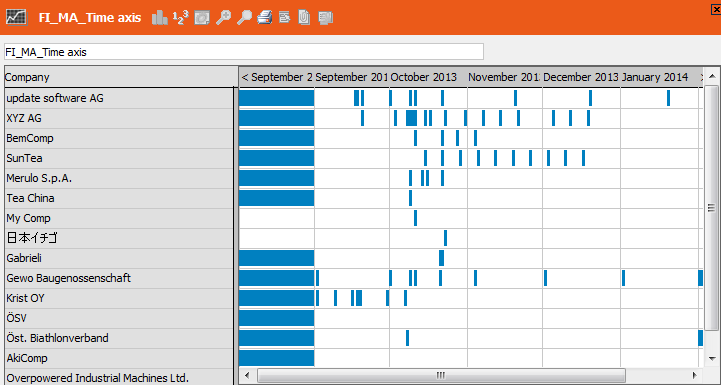
If the Aggregation option is not selected, the result is as follows:
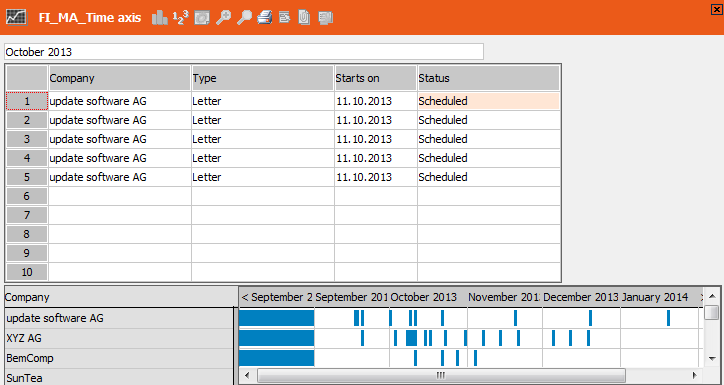
Drill-through
If you click on a bar in a cell, all records from the selected area are displayed above the analysis:
Using Several Axes
You can define several units:
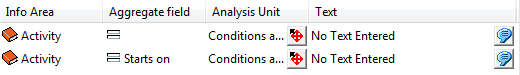
Only one unit is ever active at one time. Switch between different units using the < X and X > entries in the context menu.
Aggregation
If you enable the Aggregation option when defining the Analysis Unit, the data is grouped by field, not by parent info area.
Example: Opportunities by Completion Date
Settings:
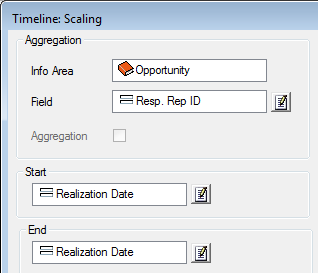
Result:
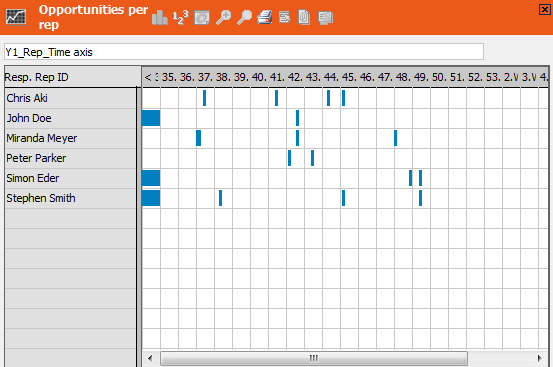
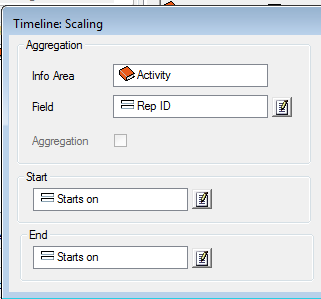
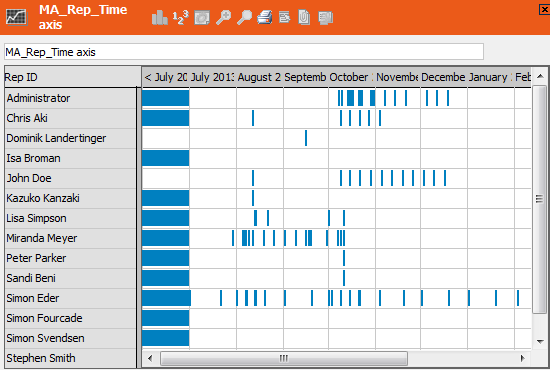
Example: Resource View per Rep
In the following example, the activities for each rep are displayed, with the scale set to monthly.
Settings:
Result:
Single Display
You can choose to display single records in the time analysis. Each record is displayed in a cell in the corresponding column, instead of allocating a row to each group of records. The cells in the columns are filled from top to bottom.
Example: Opportunities by Completion Date
Settings:
Only the Opportunity info area is selected. The scale is set to display months.
Result: