Quadrants
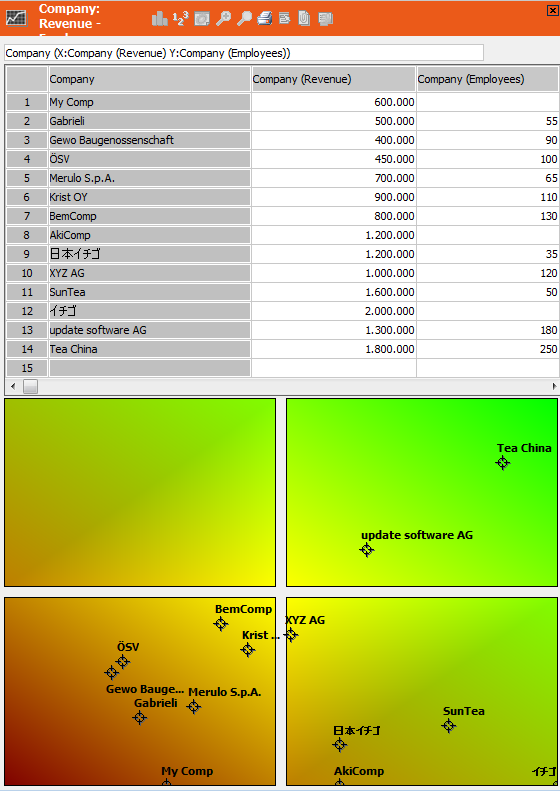
You can use the quadrant analysis to analyze records graphically based on two numerical criteria.
This can be useful e.g. to determine cost-effectiveness.
To define an analysis using quadrants:
- Select Extras > Define Analysis.
- Define the transfer fields under Info areas selection.
- Select Quadrants from the drop-down list.
- Set the Analysis Type to Quadrants in the
Analysis dialog box.Note: The Analysis Type radio buttons determine that the type of analysis is fixed. If you do not define a type, you can determine the type of analysis when executing the analysis.
- Determine the maximum Number of records to display on the Levels
tab.Note: If you accept the default value (0), then a maximum of 10 records are displayed.
- Determine the info area in which you wish to edit data (Transfer data
to) and the fields that should be displayed in the quadrants analysis.

- Switch to the Axes tab.
- Define two fields to be compared in the analysis; e.g. Revenue
and Employees .

- Click on
 (Scaling) to display the Quadrant:
Scaling dialog box.
(Scaling) to display the Quadrant:
Scaling dialog box.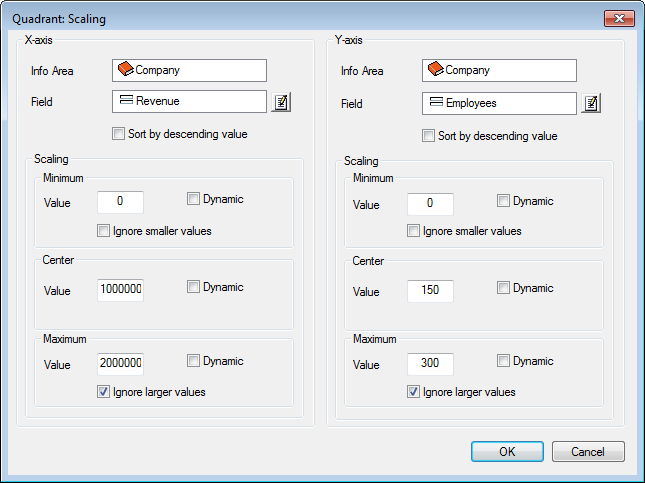
- Determine the range of values that are included in the analysis for both fields (Revenue and Employees). Select Ignore larger values and Ignore smaller values in both cases.
You can define more than one info area in the transfer fields format for a quadrants analysis. If you select a field from a dependent info area for either the x or y axis, these values are totaled. You can also choose to output the number of records. This allows you to compare the number of activities with total revenue, for example.
You can define several units. Only one is ever active at one time. Switch between different scales using the < X and X > entries in the context menu.