Complex Analyses
Learn how to perform complex analyses.
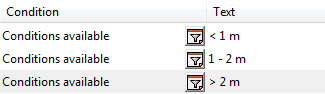
Conditions
Conditions allow you to determine further criteria used to categorize results:
- Choose the Country field for the scale of the x-axis, as in the first example above.
- As in the previous example, calculate the total revenue as an aggregation.
- In addition, define the following settings in the y-axis - scaling
tab:
- Start the analysis:
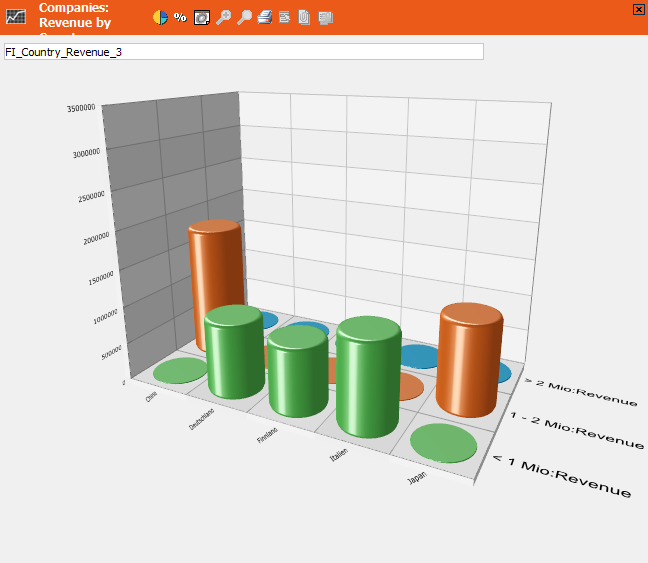
If you are using the ComponentArt graphics library, the conditions (levels) are displayed behind one another. If you are using Aurea's graphics, select Split Levels to display each level separately.
Multiple Scales
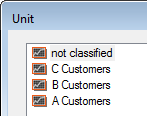
You can define more than one unit for the x-axis; e.g. for Country and ABC:
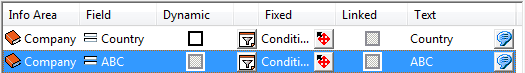
The same data in the analysis is then grouped using two different criteria. Both analyses are displayed separately. There is no combined analysis using both the Country and ABC fields for classification (use the y-axis and conditions to do this).
When you execute the analysis, the first analysis unit is used. To switch to a different unit:
- Select either > X or < X from the context menu.
- Click on the header in the table view.
Analyzing Dependent Info Areas
When analyzing dependent info areas (e.g. activities), information from the parent info area (company) is also relevant. Therefore, the drill-through analysis lists both the fields from the dependent and the parent info area.
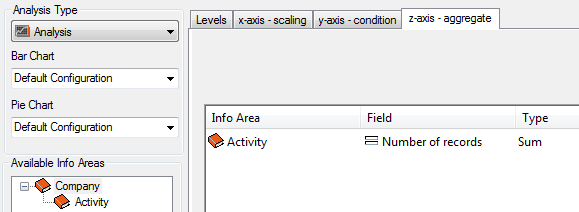
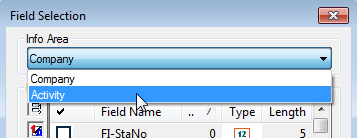
To define an analysis for a dependent info area:
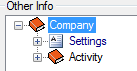
- Define the parent info area (e.g. Company) as the first info
area in the transfer fields format, and then the dependent info area (e.g.
Activity) below the parent info area:
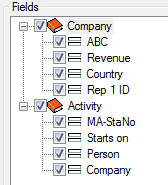
- Define the fields to be displayed for the two info areas.
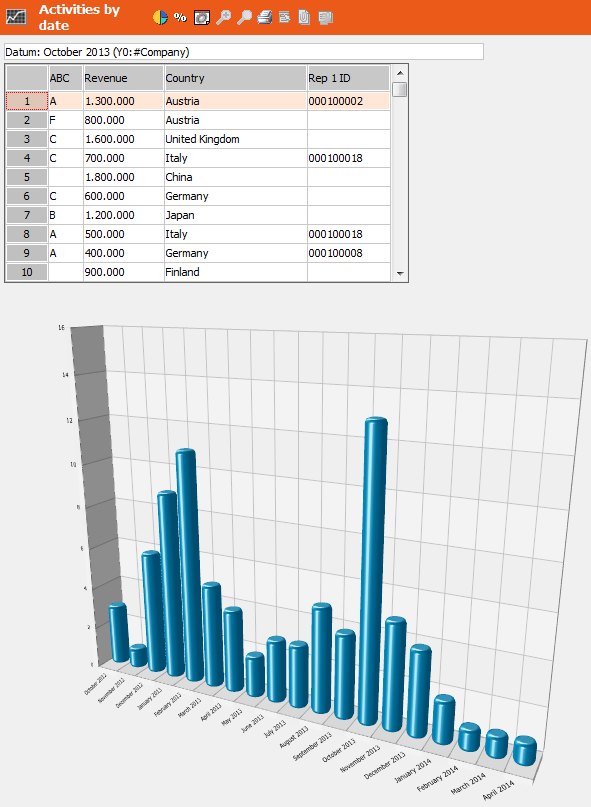
- Define a scaling and aggregation for the activity:
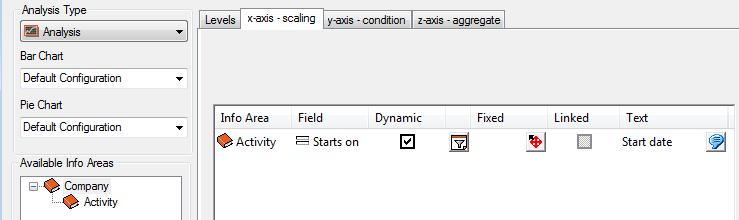
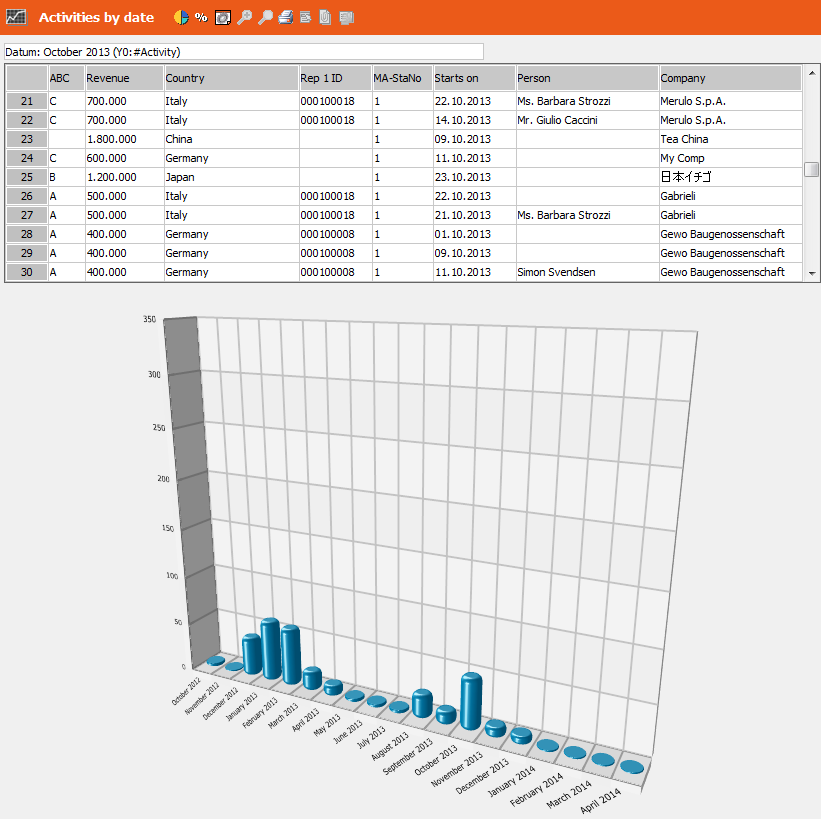
The number of activities is grouped by date in the analysis. Click on a bar to display the parent company and activity data in the table.
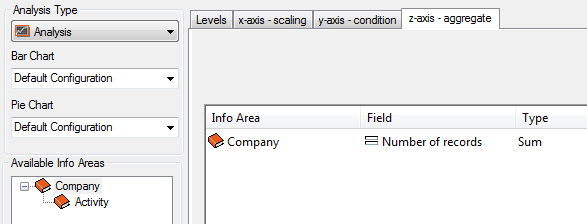
If you define the aggregation for a company field instead, the drill-through displays only company data:
Analyzing Several Info Areas
Aurea.CRM allows you to combine several info areas in one analysis. You have the following options:
- Analysis of data based on relationships in the data model, e.g. Company and Activity; Marketing Activity, Mailing and Person.
- Analysis of data not directly related in the data model but which can be associated
using common criteria; e.g. marketing activities and companies per country or
activities and orders by date. Note: If several info areas are included in the transfer fields format, you can define a unit, conditions and aggregations for each info area. The unit, condition and aggregation defined for the lower levels have no effect; only the settings for the top-most level are applied. If you want to define an aggregation for a dependent info area (e.g. Activity), select the top level (Company) but select a field from the dependent (Activity)info area in the dialog box when defining the aggregation.
You can include several info areas in the transfer fields format:
- You can define several aggregations for each unit, which can be applied to various info areas (e.g. total number of companies, activities, mailings or total revenue).
- You can group persons by specialization, for example. The number of persons, activities and relationships stored for these persons can be compared.
- You can define several units (at the top-most level) and switch between these units once the analysis is displayed. You can define several info areas at the top-most level, however it makes more sense to define these as separate and independent analyses.
Linking scales
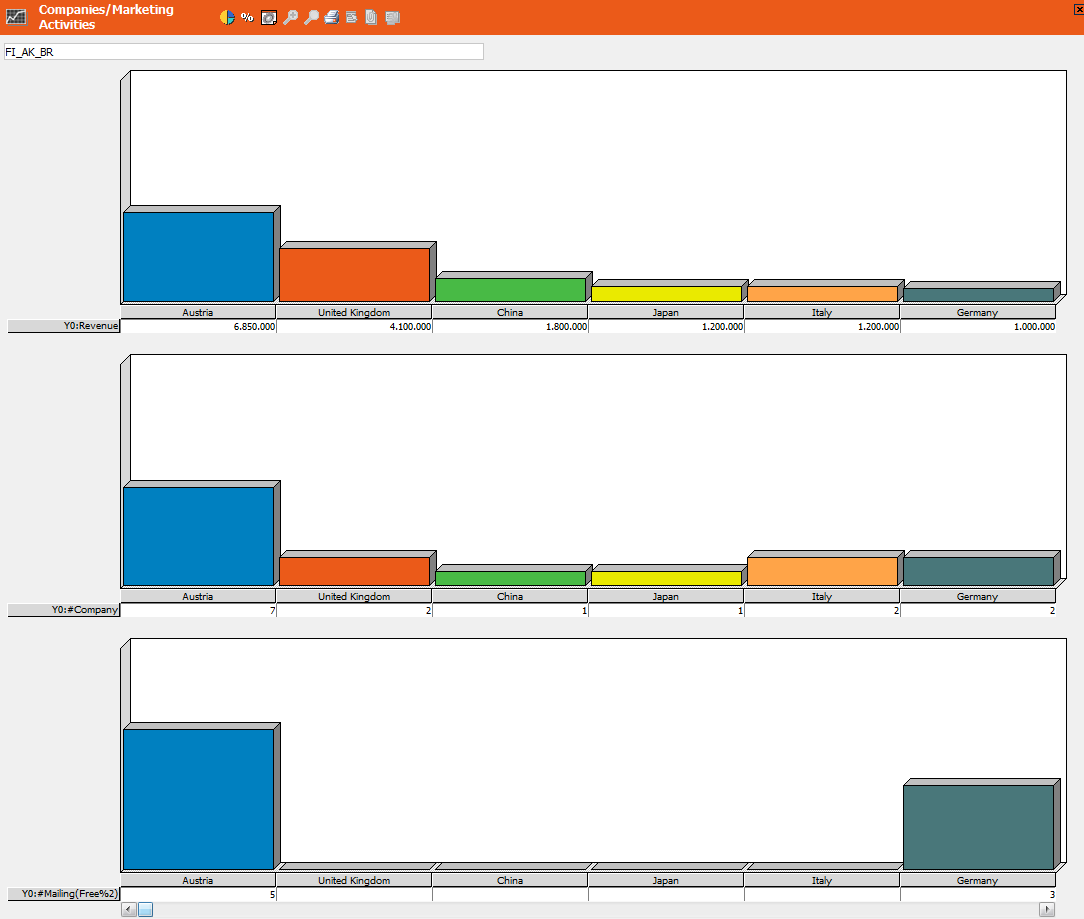
In the following example, the number of companies per country is compared to the number of marketing activities and mailings; i.e. the marketing activities and companies, which are not linked in the data model, are compared using the common field Country.
- Define the transfer fields.
- Select the following info areas:
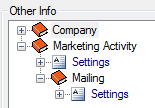
- Define an analysis unit using the Country field in the Company info area and aggregations (Revenue, No. Records).
- Select the Marketing Activity info area from the list of available info areas. The units and aggregations are no longer displayed.
- Add a new unit using the Country field in the
Marketing Activity info area.
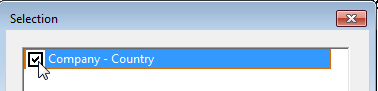
- Enable the option Company - Country. This determines that the
unit defined for the companies is used for the marketing activities. The fields need
to be of the same type; e.g. catalog fields that access the same catalog or date
fields.
The following is displayed in the x-axis - scaling tab for the marketing activity:

The Linked option indicates that this unit is linked to another unit.
- Add an aggregation for the total number of mailings for the Marketing Activity. Different aggregations are displayed, depending on whether you select Company or Marketing Activity from the list of available info areas. If you select Mailing, no aggregation is displayed.
- Start and configure the analysis (Split Levels, Descending, Percent, etc.).