Campaign Chart
Learn to view campaign graphically.
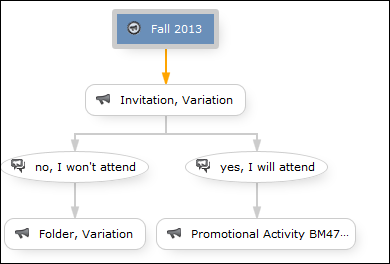
Click on the Chart tab the tree view of a campaign to display the structure of the campaign graphically.
The following options are available:
- Drag the graph to move it.
- Use your mouse wheel to zoom.
- Double-click in an empty area of the graph to revert the zoom level to 100%.
- Double-click on an element in the graph (campaign, marketing activity or response) to open the corresponding record.