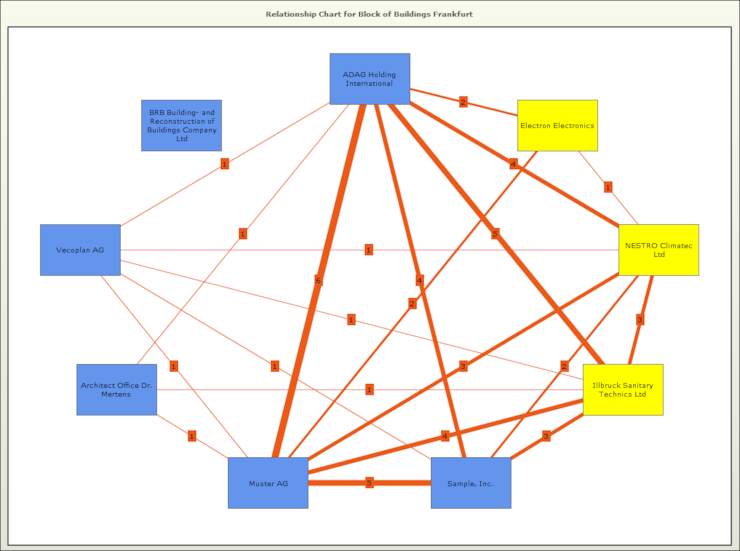
Relationship Chart and Analyses
You can display the network of relationships for all participants involved in a property. This allows you to see which companies involved in a project have previously worked together on other properties.
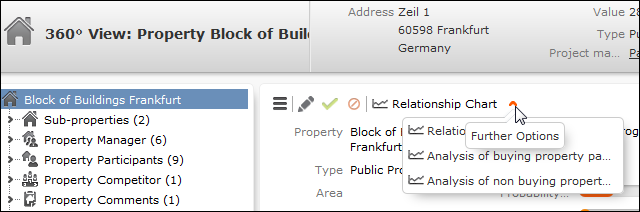
To display the relationship chart for a property:
- Click Relationship Chart.
Companies are color-coded according to their current roles, the width of the connectors between companies is determined by the number of common projects carried out by the companies in the past.
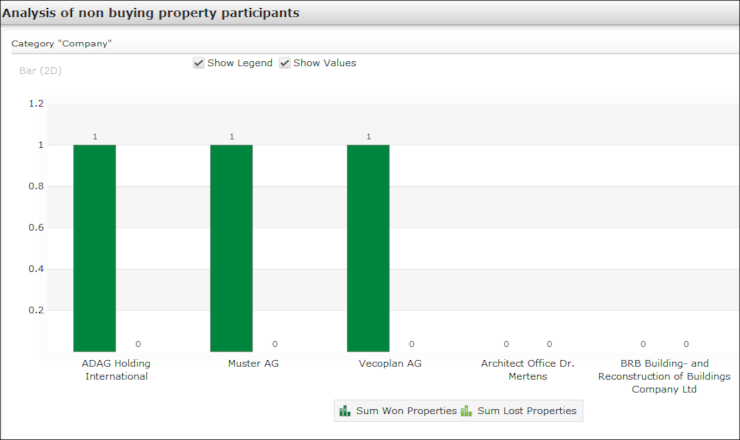
In order to analyze how successful property participants have been in the past, you can display a graphical analysis of the won/lost status of previous projects involving this person.
To display the participants analysis:
- Click on the small downwards arrow and select Analysis of buying property participants or Analysis of non buying property participants.