Defining Chart Elements
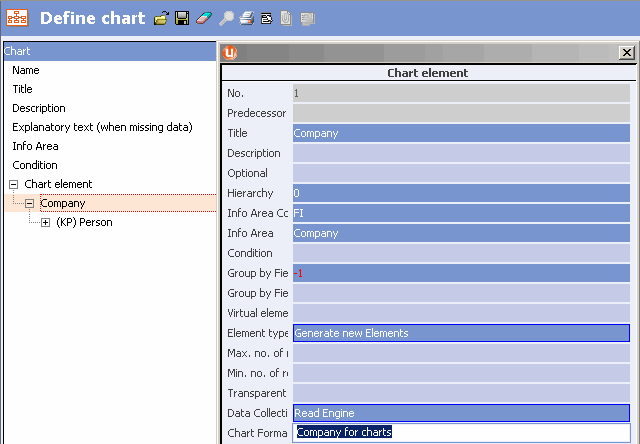
Chart elements determine which records are read from the database and which record data is used by nodes in the XML output or chart.
To define the elements in a chart format:
- Click on the Chart element entry and select
New from the context menu.
A new chart element is added.
- Click on the arrow icon in the Title field and enter a
title.
This title is displayed in the hierarchical view of the chart element instead of the automatically assigned ID (No. field).
- Use the following fields to define how the root node of the chart should be determined:
- Info Area: Specify the target info area to search for records.
-
Element type: Determine how records that are found are
handled in the report:
- Generate new Elements: A new element (node) is created for the record.
- Saves Records: All records found are grouped in a single element.
- Data Collection: Determine whether the data in the chart is determined using transfer fields ("Read Engine") or a global query (Aurea CRM web only).
-
Chart Format: Double-click in this field and define the
fields that should be transferred to the report in a transfer fields format, or
select the query.
For more details on transfer fields, see Transfer Fields in the User Manual.

- Use the following fields to define how the root node’s children are determined:
- Chart Data (Children): Determine whether the data in the chart is determined using transfer fields ("Read Engine") or a global query (Aurea CRM web only).
- Chart Format (Chart Format (Children)): Double-click in this field and define the fields that should be transferred to the report in a transfer fields format, or select the query.
- You can add additional chart elements to the root node and other chart elements (by
selecting New from the context menu), allowing you to depict your
structure. There is no restriction on the number levels in the hierarchy.

For more information on the individual fields in chart elements, refer to the online field help. You can:
- Define conditions that must be met by records
- Group nodes by catalog value
- Recursively determine the records in the chart
- Link the report to workflows, triggers or Aurea CRM web wizards.
You can use drag & drop to move chart elements within the structure.
While it is possible to include a variable condition in the chart's definition, the dialog used to enter the variable value is not displayed when generating the report.