Metrics
Learn to provide a context for a process and phase metrics.
![]()
You can define process and phase metrics (text and/or graphics) to provide a "where am I and what's my status" context for the user. E.g. if the goal of a phase is to create activities, the number of needed activities to reach the next phase can be displayed as a phase metric of type "Text".
To define metrics:
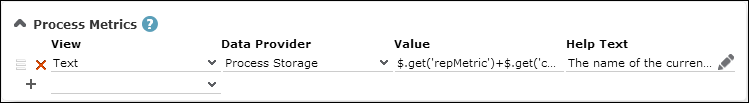
- Select a View, i.e. the type of metric you want to display.
- Select a Data Providers.
Available data providers:
- for process metrics: none, Input Message, Process Storage, custom data providers
- for phase metrics: none, Process Storage, custom data providers
- Enter a Value or a condition using JavaScript, e.g.
!!$.get('curY1Uid')?100:0for a "PercentageTrafficLight" metric - You can define an (optional) Help Text to provide an explanation of the displayed metrics. The Help Text is displayed on mouse-over for metrics contained in phase arrows, and on both mouse-over or click for phase metrics displayed on the right side of the header.
Each defined metric is displayed in an extra row.
The following views are available:
- Html: Displays text with HTML tags e.g. <BR>.
- Image: Displays images depending on a condition.
- Percentage: Displays percentage values.
- PercentageTrafficLight: Displays a traffic light image based on percentage values (red: 0-33 | yellow: 34-66 | green: >66).
- Text: Displays text.
- TrafficLight: Displays a traffic light image (0: red | 1: yellow | 2: green | -1: no traffic light).
To display multilingual texts (in Html and Text metrics) define and use a custom data
provider with the UsingDataProvider action template. For further details,
see UsingDataProvider.