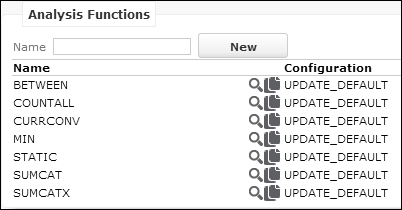
Analysis Functions
Learn about analysis function.
When defining additional values you can use special aggregation functions to calculate the value, see Additional Values.
Enter the formula to calculate the value in the Parameter field:
![]()
Syntax for referencing field values: $<infoAreaID>[<field name or number>]
The field must be part of the underlying query.
Use $Y1
[0]
[FreeN1] and $Y1
[1]
[FreeN1] for multiple occurrences of a field.
UPDATE_DEFAULT contains the following analysis functions:
-
$BETWEEN([cmpval, minval, maxval, trueval, falseval]):Returns records within a certain range. Acmpvalbetweenminvalandmaxval(including the bounds) returnstrueval, everything else returnsfalseval.Examples:
Sales opportunities within the first half-year of 2012:
For more information on the dateToString function, see the article “The Type Converter Service” at https://support.aurea.com.$BETWEEN([u8.services.typeConverter.dateToString(($!Y1[CompletDate]), {format: "YYYYMMDD"}),"20120101","20120630",$Y1[TotalProdValue],0])>Contact records with costs between 1000 and 1500:
$BETWEEN([$MA[7],"1000","1500",$MA[59],0])Note: Note: If a query calculates average values (e. g. average costs), the costs are divided by the total costs of all records in the category. -
$COUNT(value):Returns the sum of different record for a record (e.g. number of opportunities per company). -
$COUNTX(value):returns the number of records per XCategory and Category. -
$CURRCONV(value):Returns the value corrected by a conversion factor (if a currency column is specified). -
$MAX(param):Returns the maximum value of all values passed inparam.paramis a JavaScript array of n values with the syntax[value1,value2,…].Example:
$MAX([$Y1[TotalProdValue],$Y1[WtdTotalProdValue],$Y1[OPWtdTotalProdValue]]) -
$MIN(param):Returns the minimum value of all values passed inparam(same syntax as$MAX). -
$PERCENT(value):Returns the percentage of the value in the current row compared to the summed value over all rows.$PERCENT(value)is short forvalue*100/$SUM(value). -
$SUM(value):Returns the sum of the value over all rows independently of the category. -
$SUMCAT(value):Returns the sum of a value within a category.Example: Analysis of AK with MA with Y1 calculating the average marketing activity cost per opportunity for each category:
Average $SUMCAT($AK[37])/Math.pow($COUNT($Y1),2) -
$SUMCATDISTINCT(param1, param2):Where
param1is a JavaScript array of N values with the syntax[value1,value2,…,valueN]andparam2is a category.The function returns the sum of distinct values in an array for a category. It works the same way as $SUMCAT if the values are numeric and returns the sum of a value within a category.
If the argument is an array and the array has only one element, then the value is added as value for key 'const', and indicates a static value.
If the argument is an Array with more than one element, the function tries to add values for distinct keys or categories defined in param 2.
Example 1:
$SUMCATDISTINCT([$FI[5],$FI])returns the sum of all unique FI records for field #5, and if a n:1 linked table like MA is used in the same formula with multiple MA records pointing to the same FI, then each FI is summed just once.Example 2: If the search result set were to have a list of 3 records containing the item name and number of items in an order: {25, item1}, {30, item2}, {40, item1}. Then applying the function on the array returns a result set containing {65, item1}, {30, item2}.
-
$SUMCATX(value):returns the sum per XCategory and Category. -
$WEIGHTCONV(value):Returns the value corrected by a weight factor (if a weight column is specified).
You can add custom analysis functions on the Analyses page:
Analysis functions are defined by a name and its JavaScript class name.
Questionnaire Analysis
UPDATE_DEFAULT contains the configuration of a survey results analysis (answers per question).
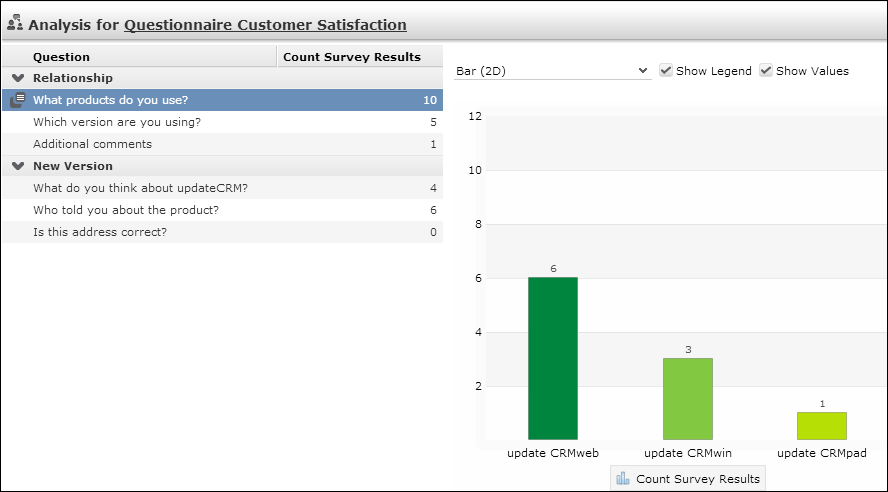
The left part of the page lists all questions of the selected questionnaire. Question records with New Section checked are displayed as group headers. Question records with Do not display (F2:23) checked are not listed.
Analysis.MaxRecords Web Configuration parameter to ensure that all
results are displayed, see Analysis.MaxRecords.Clicking on a question displays the analysis chart of the answers. For textual answers
(Edit Answer checkded) a list of answers is displayed instead
of the analysis chart. This list is configured by the List control of field group
U2.Analysis.
For information on defining questionnaires and conducting surveys, see Surveys in the Web Business Logic User Guide.
Questionnaire Analysis consists of the following configuration units:
- The Questionnaire Analysis is called by menu item
A_QuestionnaireAnalysisin theM_QuestionnaireViewcontext menu (Collaboration > Questionnaire > Questionnaire Analysis). This calls aShowFormaction displaying theQuestionnaireAnalysisform. - The
QuestionnaireAnalysisform consists of a header and aQuestionnaireAnalysiswidget containing the configuration of the list of questions and the analysis chart.You can configure/change defaults for the following chart properties via the Form Designer (
TheanswerAnalysisparameters for widgetQuestionnaireAnalysis):chartType,fixedChartType,hideSelector,showLegend,showValues,showEditor.fieldGroupNameparameter allows you to specify another field group for the textual answers list. - The
QuestionnaireAnalysiswidget uses the following queries:-
Questionnaire_SurveyResultsproviding the data for the list. -
Questionnaire_SurveyAnswersproviding data for the analysis chart.
-
The QuestionnaireAnalysis widget uses the following analyses:
Bubble Chart Analyses
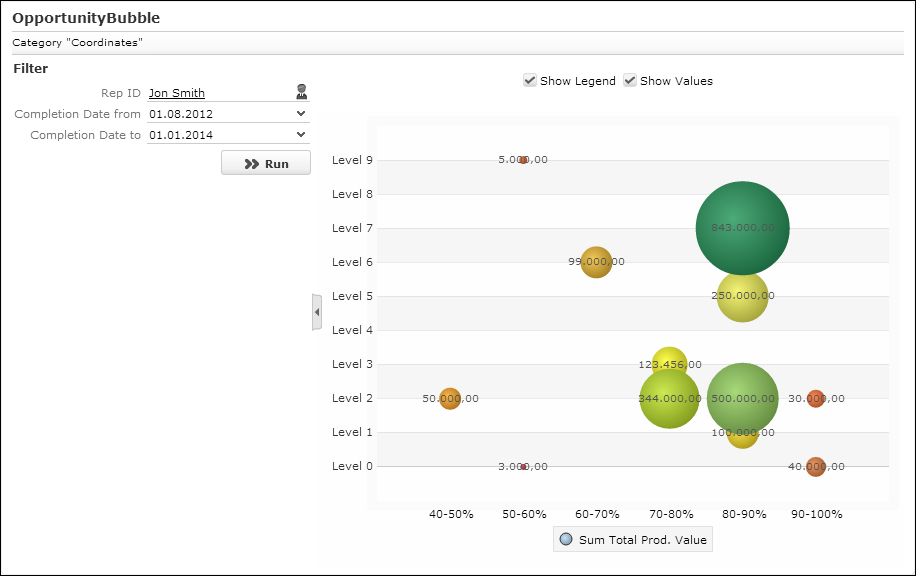
You can configure analyses to use Fusion Bubble charts as chart type. This chart type is not visible/selectable in Aurea CRM.Web. Display-Order = -1). For further details, see Chart Types.
UPDATE_DEFAULT contains two bubble chart analyses OpportunityBubble and
TicketBubble which can be displayed via the application menu entries
ID_NET_OpportunityBubble and
ID_NET_TicketBubble.
Each bubble is defined by an X,Y coordinate pair and the bubble size (z-axis). These values must be provided by the analysis definition, see Defining Analyses.
Example: OpportunityBubble
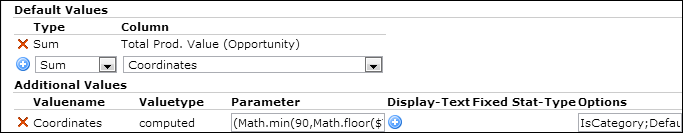
- The bubble size is calculated based on the 1st analysis value defined under Default Values, in this example the Total Prod. Value.
- The X,Y coordinates pair must be defined as Additional Value of type
"computed", >> Additional Values.
Separate the values for X and Y by semicolon.
(Math.min(90,Math.floor($Y1[ProbabilityP]/10)*10))+';'+$Y1[Level]In this example, X is calculated based on the Realization Probability (in steps of 10 via the explicit analysis category
Percentage_10Sliced), Y based on the Level.