Chart Types
Define a new chart type suitable for every purpose.
Aurea CRM.Web uses FusionCharts for the graphical display of analysis results. For further details, see AnalysisRun.
On the CRM.Designer main page in the Filter | Query | Analysis area
click ![]() Chart Types to display all available chart types.
Chart Types to display all available chart types.
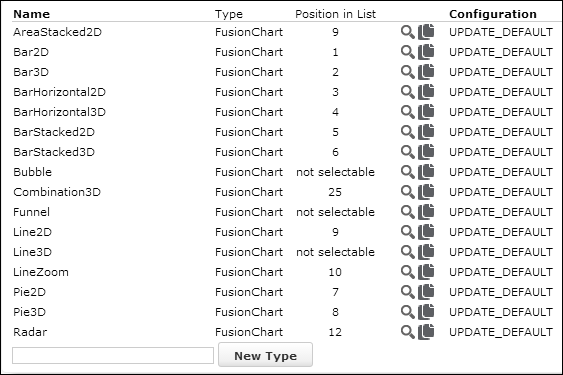
You can edit existing chart types or create new ones. For further details, see Designing Configuration Units.
The following settings are available:
-
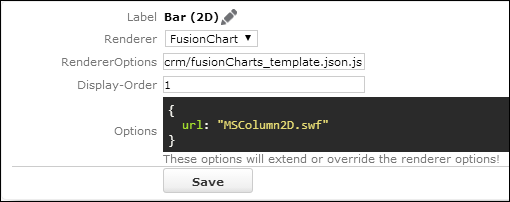
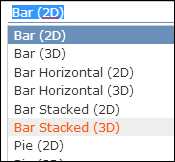
Label: The text in the chart type drop-down list.
The texts are saved in the
net_charttype_textText Group. For further details, see Texts. - Renderer: The charting engine used: "FusionChart".
-
RendererOptions: The default settings for all chart types are
saved in the
fusionCharts_template.json.jsfile located in the..\web\datadirectory. Enter another file name to provide your own settings file.Alternatively you can use the Options field to specify renderer options (see below).
Information on all available settings and renderer options. For further details, see http://docs.fusioncharts.com/charts/ (section "Chart XML API").
- Display-Order: Determines the order in which the chart types are displayed in the chart type drop-down list. Set the Display-Order to "-1" to hide a chart type from the drop-down list. Charts with Display-Order =-1 are labeled as "not selectable" on the Chart Types page (e.g. Funnel, Bubble). Such chart types cannot be selected by users in Aurea CRM.Web.
- Options: Displays the file used for the selected chart type. Here you can enter additional renderer options or change existing ones thus overruling the definition in the file specified in RendererOptions.
Detailed information on defining chart types, see the article “How to Define a New Fusion Chart Type” at https://support.aurea.com.
Use the SDK page to further explore the charts functionality: SDK > Charts.