Key Performance Indicators (Aurea Enterprise)
An overview of the Key Performance Indicators dashboard.
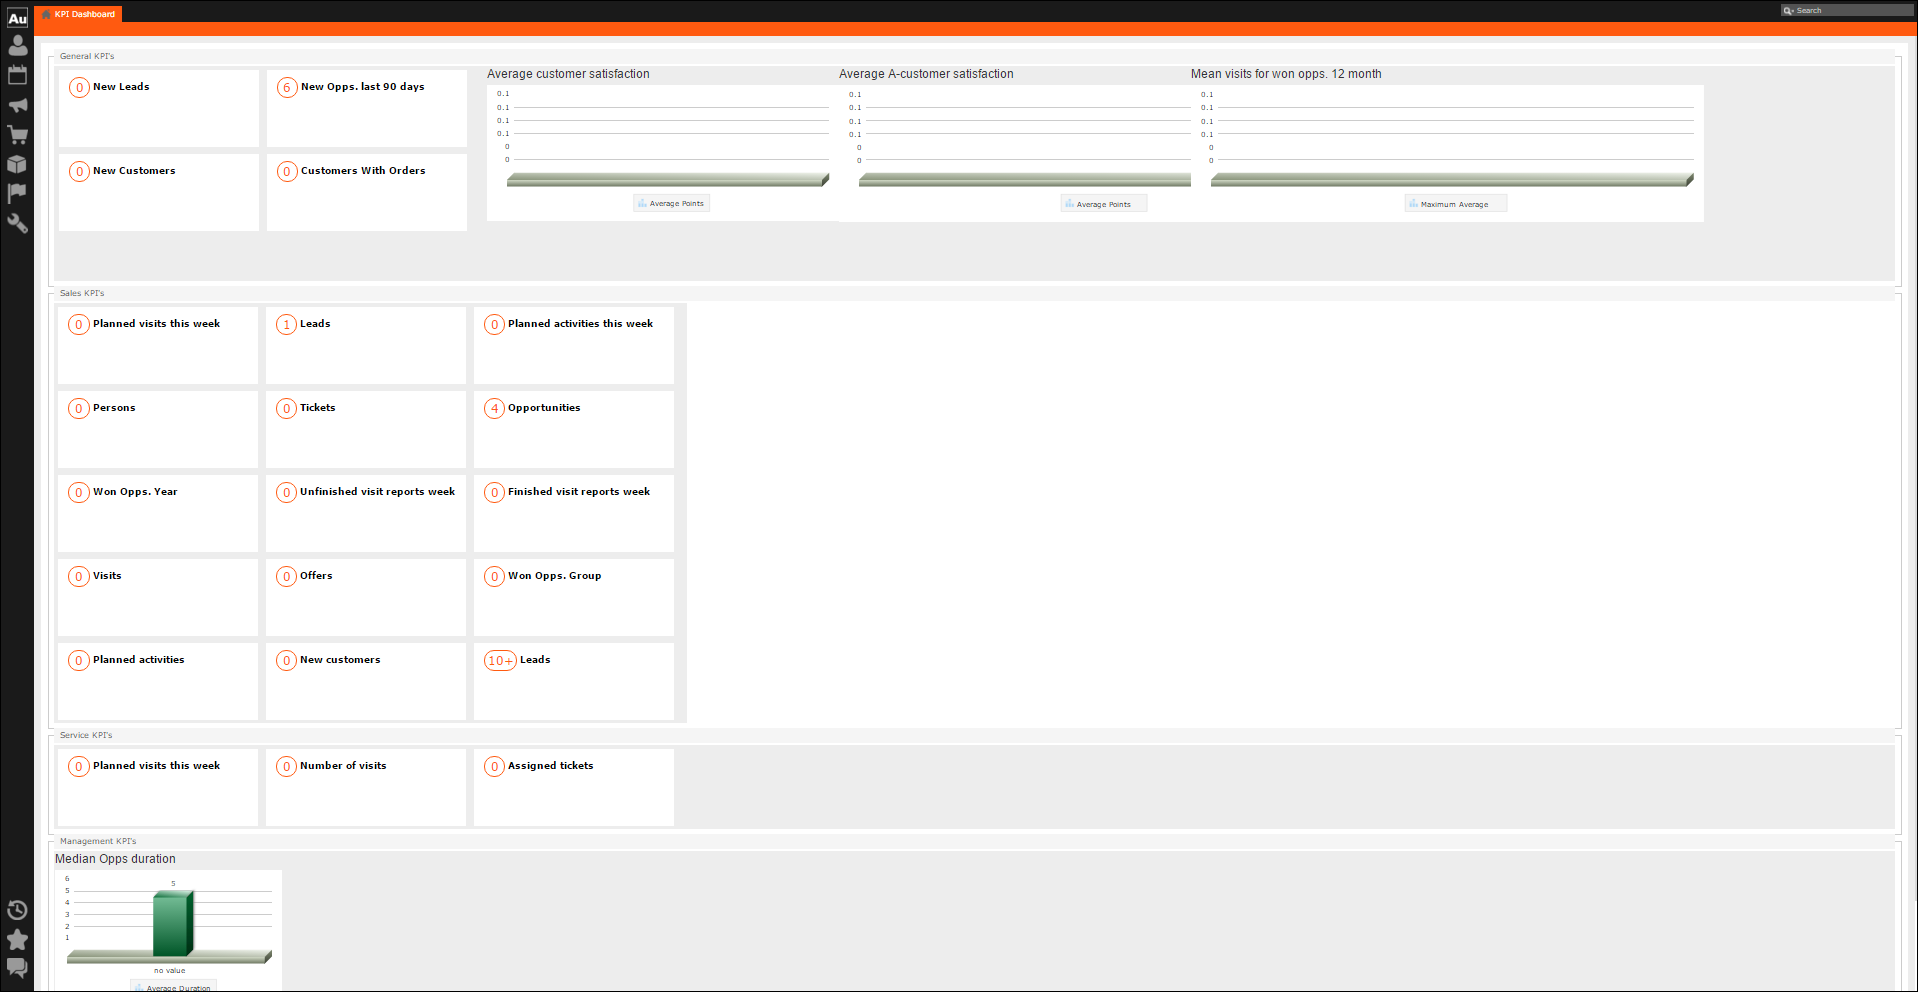
The KPI dashboard provides a quick measure of your business metrics primarily focusing on customer development and management. It shows the current state of your sales for existing and new customers. This would be very useful in monitoring open calls, new customers of interest and other related information without having to be informed by email.
The following screenshot shows the KPI dashboard.
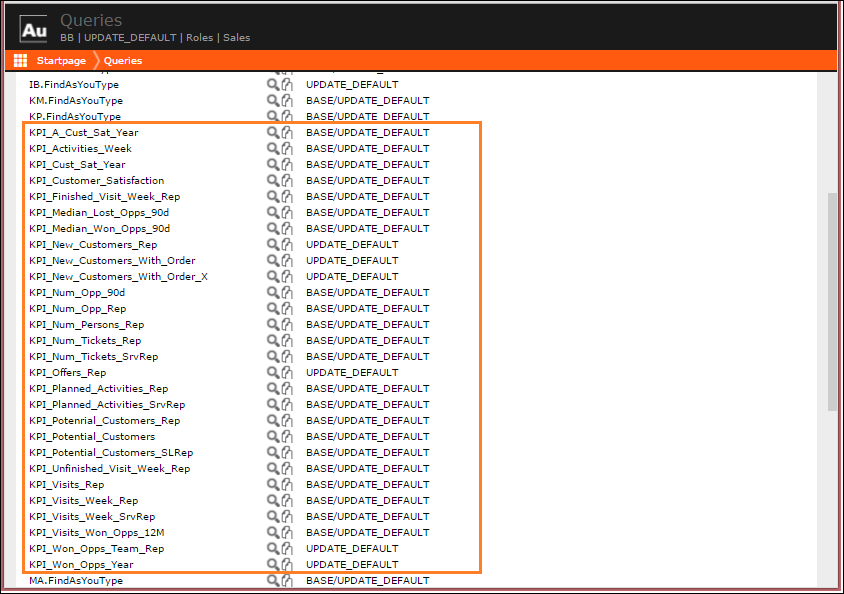
The queries that correspond to the KPI metrics displayed to the CRM users are defined in the CRM.Designer as shown in the screenshot below:
You can configure the KPI Dashboard queries according to the requirements of your users and customers. For example, you may have to set the values of some parameters that can vary for different users. The following screenshot shows the order size value that can be set as required for the Customers With Orders metric displayed on the dashboard.

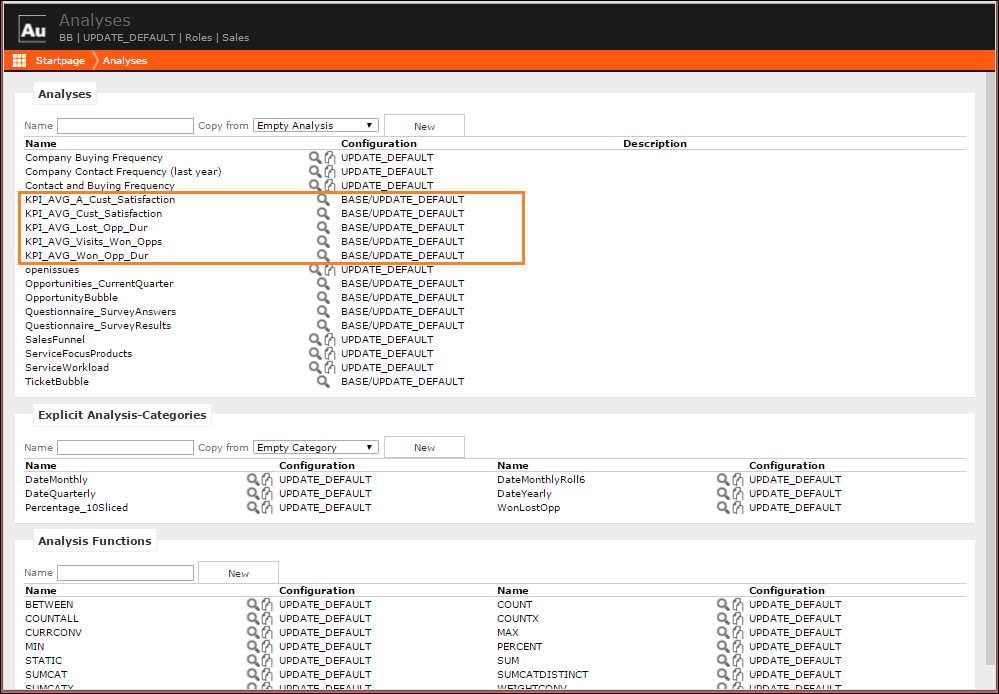
The following screenshot shows the KPI related Analyses available for use out of the box.
To develop a new Analysis for the KPI dashboard using the existing KPI Analyses as templates, perform the following:
- Create a copy of the required KPI Analyses you want use as a suitable template.
- Edit and change the Analyses according to the new requirements.
- Save it with a new name.
- Apply the new Analyses into the KPIDashboard form. The following screenshot shows the
KPIDashboard form. For more information on working with forms, see Forms.
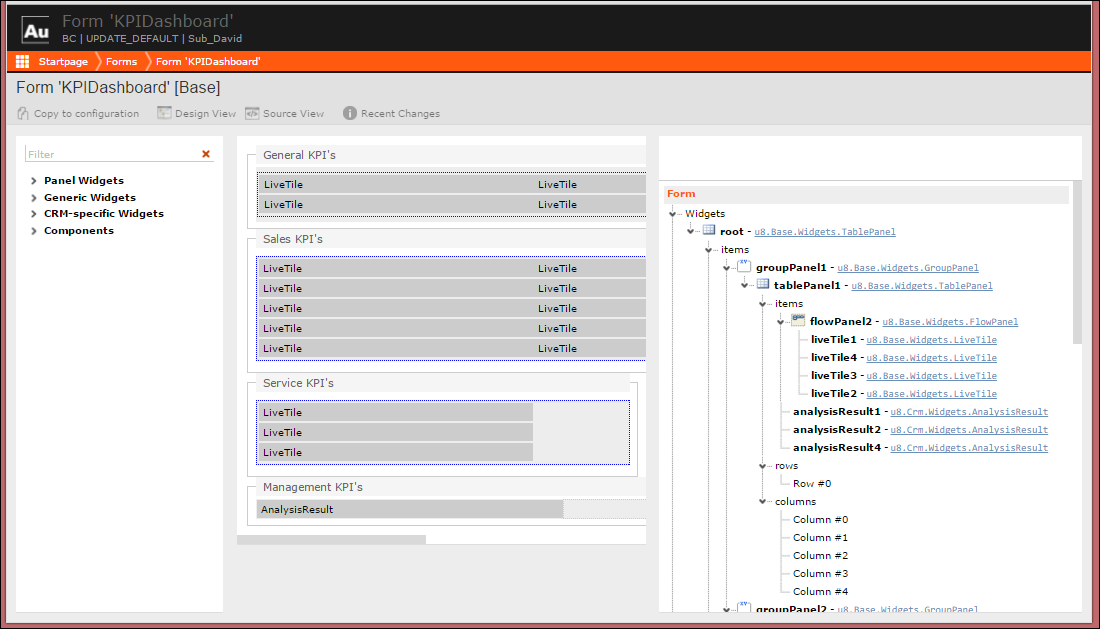 Note: All items in the KPIDashboard form are by default linked to the proper CRM processes, but they can be configured and adapted.