NYISO Rate Calculation Graphical User Interfaces
Learn how to calculate NYISO rate.
The Energy Market Cost and Rate Dash Board shows the energy cost and rate calculation program dash board information.
Energy Market Cost and Rate Dash Board

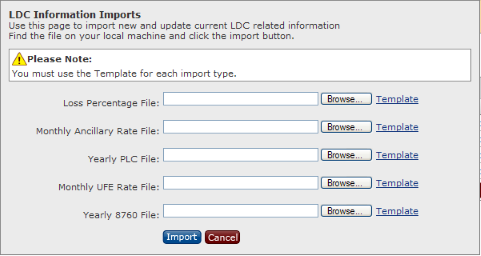
The Rate Calculation Component Import User Interface shows one example of user interfaces to import LDC information into the rate calculation engine. The components can be imported as individual files or imported as a batch.
Rate Calculation Component Import User Interface
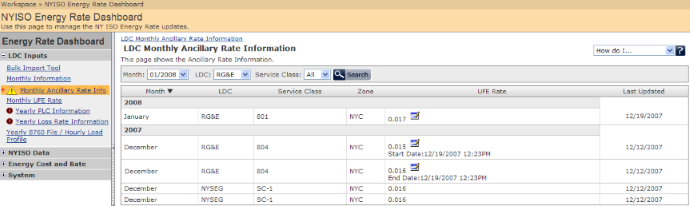
The LDC Ancillary Information Interface shows one example of user interfaces to import NYISO information into the rate calculation engine.
LDC Ancillary Information Interface
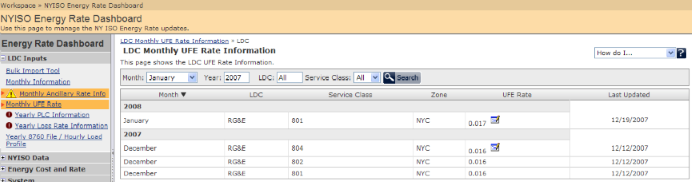
The LDC UFE Information Interface shows LDC monthly UFE Rate information.
LDC UFE Information Interface
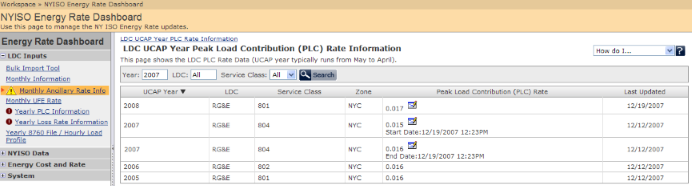
The LDC UCAP Year PLC Data Interface shows LDC UCAP Year PLC Data information.
LDC UCAP Year PLC Data Interface
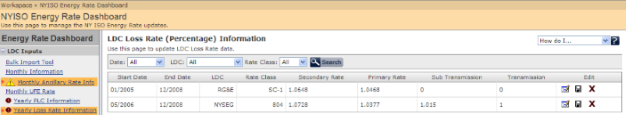
The LDC Loss Rate Data Interface shows LDC loss rate information.
LDC Loss Rate Data Interface
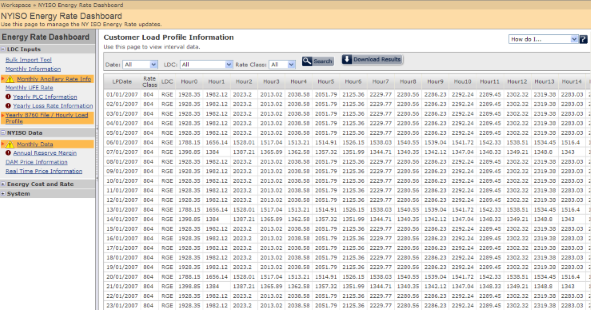
The image below shows one example of Load Profile Interval data.
LDC Load Interval Data Example
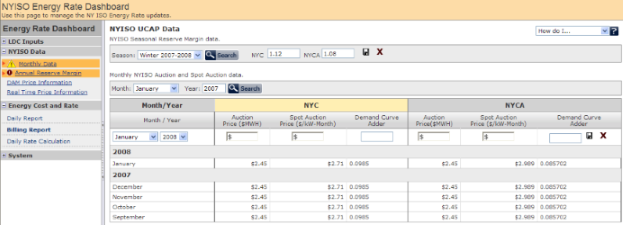
The NYISO UCAP Data Interface shows NYISO UCAP Data information including Seasonal Reserve Margin, Monthly Auction and Spot Auction Price and Demand Curve Adder.
NYISO UCAP Data
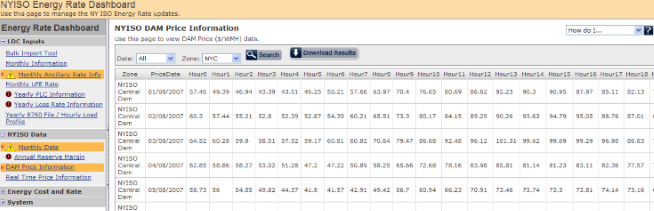
This shows one example of NYISO DAM Price.
NYISO DAM Price Example
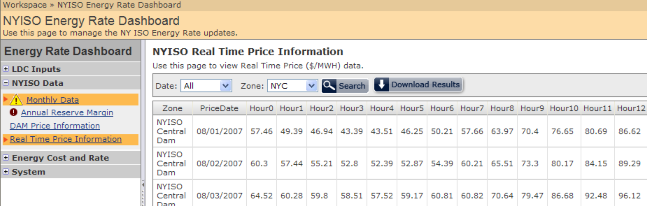
The NYISO Real Time Price Data Interface shows one example of NYISO real time price information.
NYISO Real Time Price Data Interface
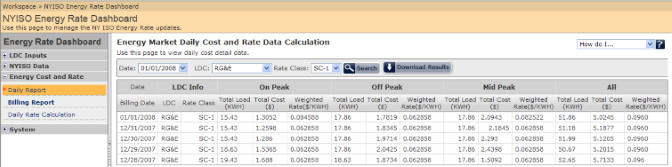
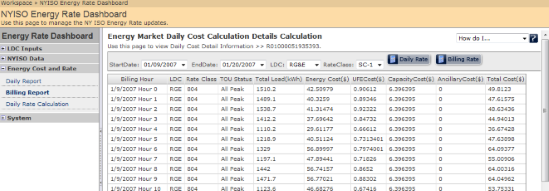
The image below shows one example of Daily Energy Cost and Rate Calculation.
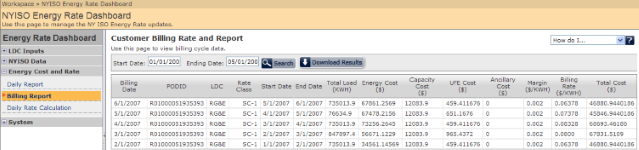
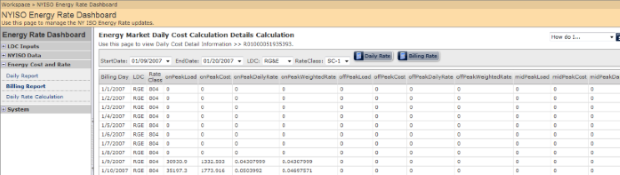
The image below shows Customer billing cycle calculation details.
The image below shows one example of Hourly Energy Cost and Rate Calculation.
The image below shows one example of Energy Cost and Rate Calculation detail information for a billing cycle.
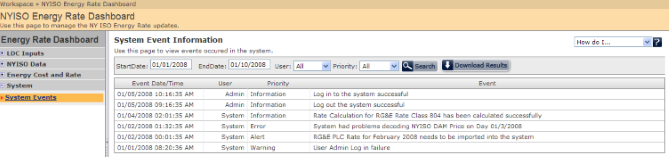
The System Event Interface shows one example of System Events.