Viewing and Using Analyses
Analyses are based upon queries and display the resulting records in an aggregated form including a graphical representation of relationships.
In the CRM.pad application you can execute the analysis pre-configured and made available by your CRM administrator. You can choose to display the results of an Analyses in a grid view or a chart view. Both views allow you to drill down into the results and navigate between the drill levels. Analyses provides a small sub-set of intelligence capabilities of a full-fledged business intelligence tool, such as Aurea CRM.intelligence.
Loading and viewing an Analyses
To load and view a predefined Analyses, perform the following steps:
- Select the Queries and Analyses tab in the CRM,pad application.
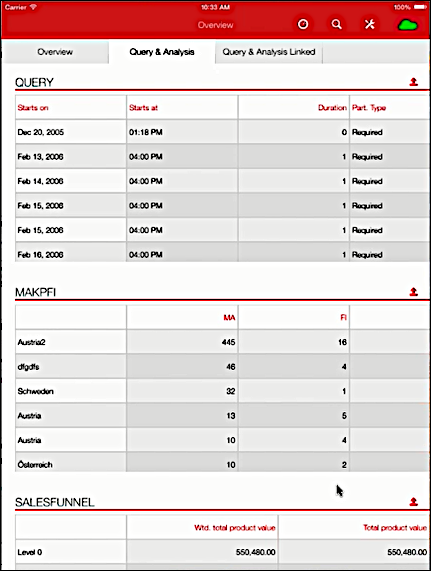
The following screenshot lists the MAKPFI and SALESFUNNEL analyses.
- Click
 against the Analyses name. The Analyses loads in the grid
view.
against the Analyses name. The Analyses loads in the grid
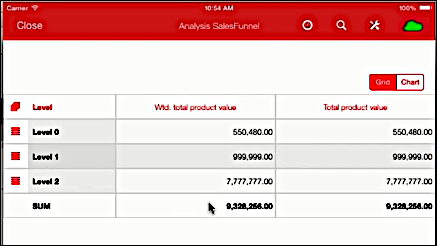
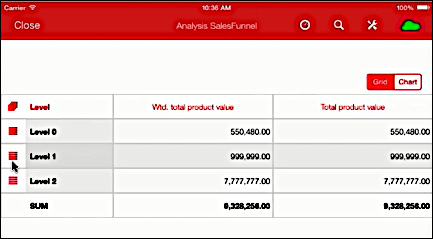
view. The following screenshot shows the Sales Funnel Analyses in the grid view.
- To change the view to chart, click Chart.
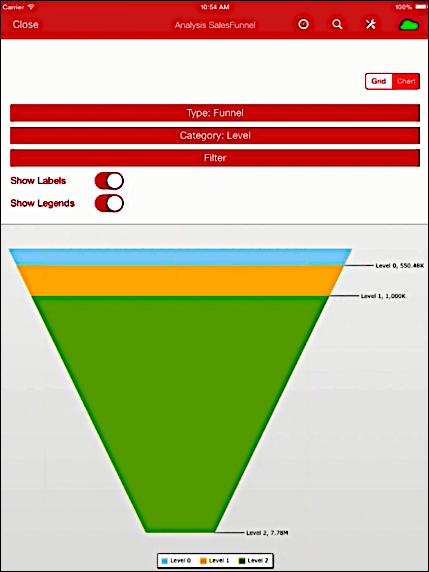
The following screenshot shows the Sales Funnel Analyses in the chart view.
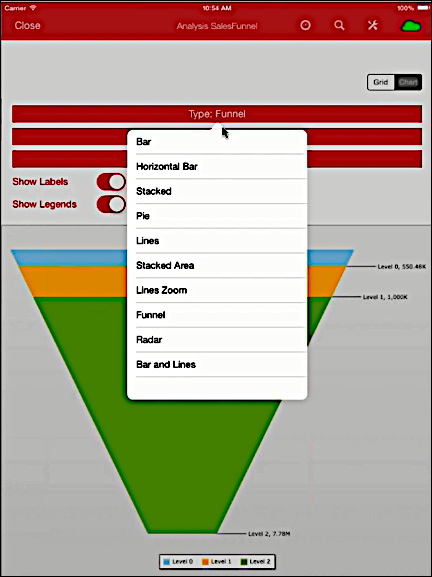
- To change the type of chart, click on the Type
:Funnel and select the chart type.
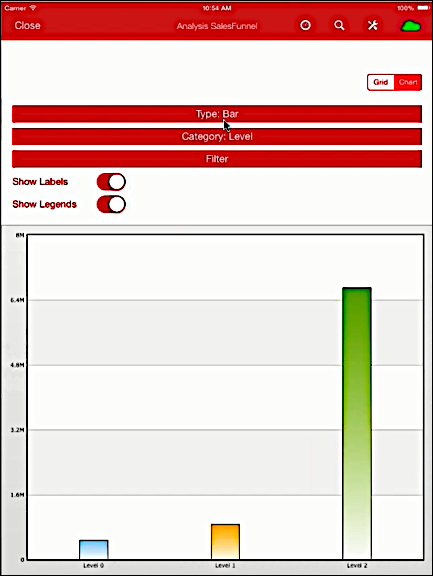
The following screenshot shows the chart as a Bar chart.
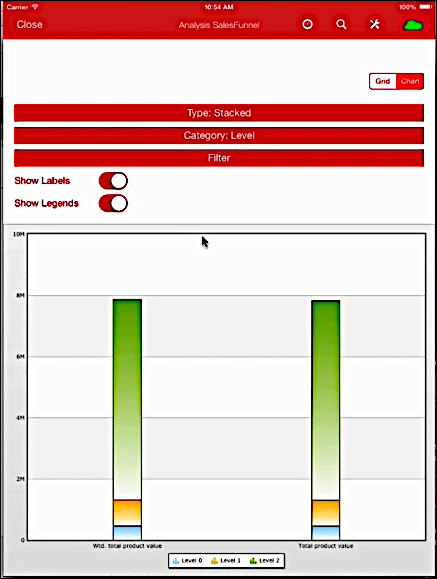
The following screenshot shows the chart as a stacked chart.
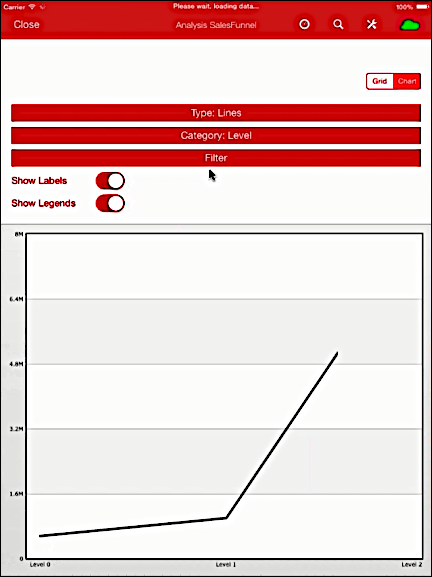
The following screenshot shows the chart as a Line chart.
- To change the category of information displayed, click the
Category bar and select the required option.
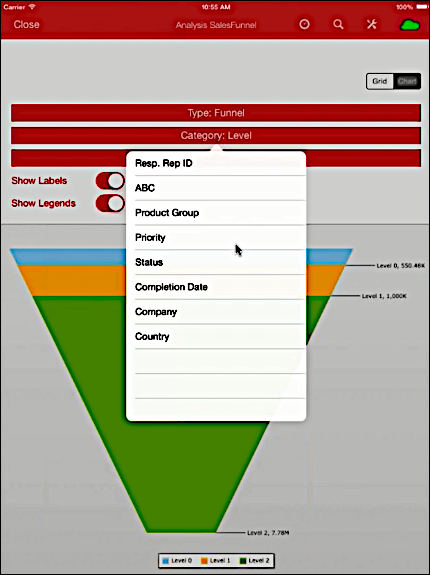
The following screenshot shows the category, Resp Rep ID:
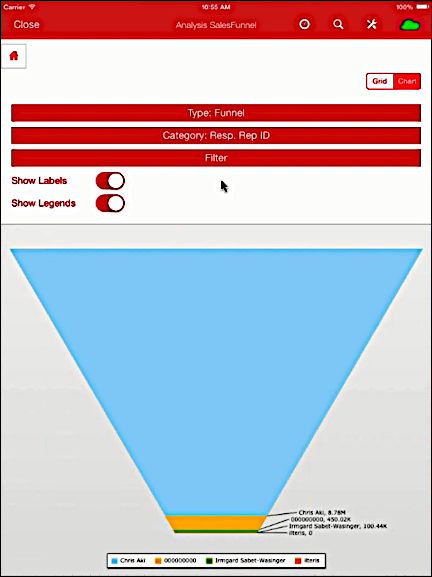
- You can show or hide, legends and labels by using the Show
Labels and Show Legends check boxes.
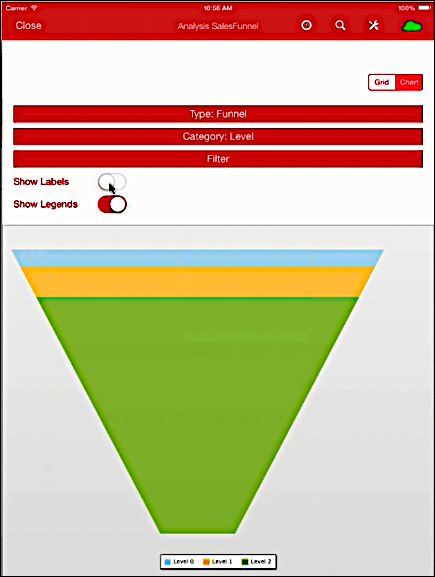
The following screenshot shows the chart without the labels.
Drill-Down an Analysis
You can analyze a value in the analysis further and proceed downwards step by step (drill-down). Conversely you can return from lower levels to higher levels (drill-up). Only the category fields selected in the analysis are available here (apart from those that are analyzed at the top-most level).
To drill down the levels, perform the following:
- Start the required Analyses.
- In the chart view, select the category: Level.
- Select the chart and click the menu options. The drill-down menu options displays
depending on the level you select. You can see that the Blue section is labelled
Level 0, the Orange is labeled Level
1, and the green is labelled Level 2. Selecting
each level results in different drill down menu options depending on the level.
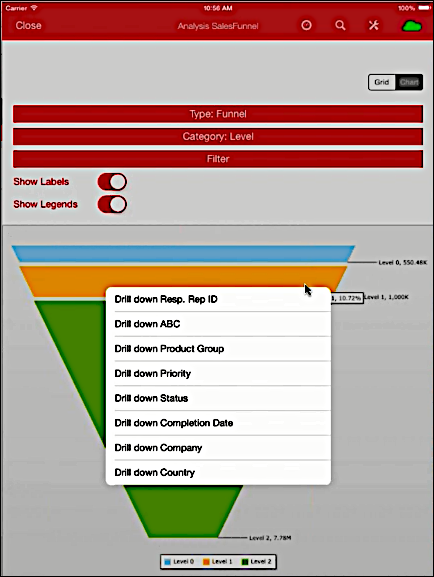
The following screenshot shows the chart on selecting Drill down Company option. Notice that the category bar is showing that you are viewing the Companies at Level1.
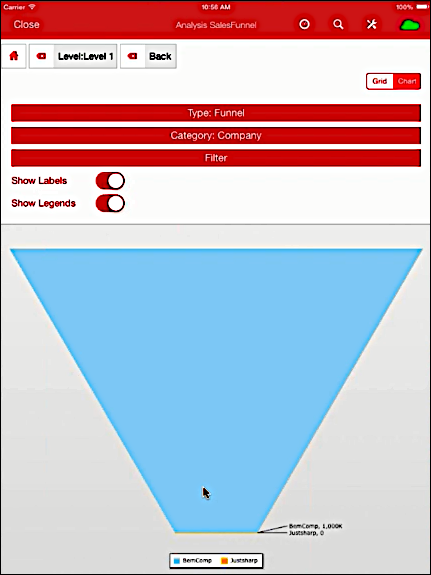
You can use the Back button to go back to the previous level.
- The Grid view provides a similar menu to drill down on selecting a particular
level.
Selecting the menu option for the Level 1 in the grid view below:
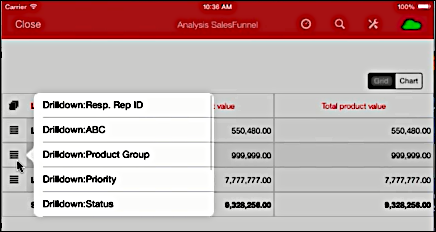
Gives the following menu options:
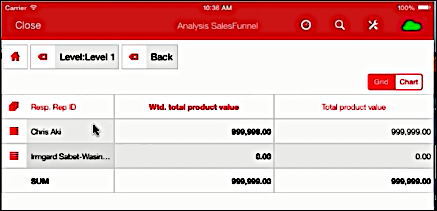
Selecting Drilldown: Resp. Rep ID results in drilling down to the Level1. Notice that the Level :Level1 label at the top shows the level you are operating at present. You can use the Back button to go back to previous level.
Note: : You can switch between the grid and chart views at each level of the drill down to get equivalent views.