Report dashboard
The Report Dashboard gives you a variety of information in graphic format about recent mailings, member lists, server performance, and sales resulting from your email marketing.
Note
The Report Dashboard requires the installation of Macromedia Flash Player.
The table below explains the options available in Report Dashboard page:
| Action | Description |
|---|---|
| To choose which mailings and time period to look at |
|
| To change the mailings and time period being viewed | Follow the steps above to make different selections, and then click Go |
| To view more detailed information about a section of the Dashboard |
Click the View data command for that section
|
|
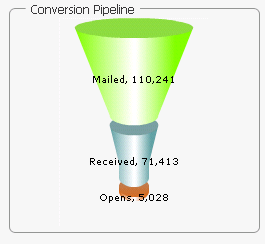
Conversion Pipeline |
This gives you a graphic representation of the following:
|
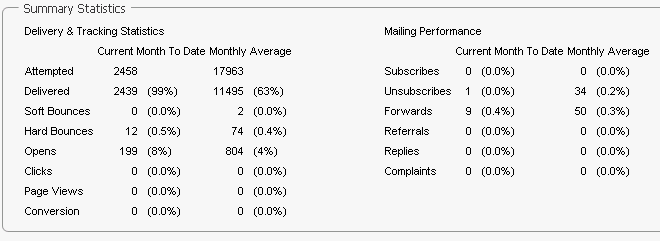
| Summary Statistics |
This gives you a Delivery and Tracking Statistics and Mailing Performance for the current month-to-date
|
|
Membership Health |
The chart on the left tracks the overall size of your list; the chart on the right gives you information about unsubscribes and new members To view the statistic for a particular month, move the pointer over the node for that month in the first chart, or the the bar for that month in the second chart
|
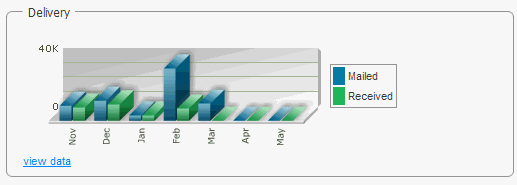
| Delivery |
This shows you how much mail was send and received To view the statistic for a particular month, move the pointer over the bar for that month
|
|
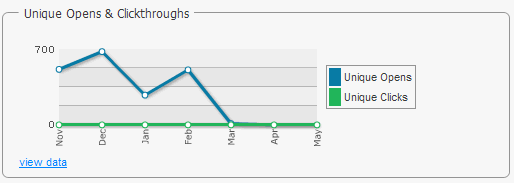
Unique Opens & Clickthroughs |
This shows you unique opens and unique clicks To view the statistic for a particular month, move the pointer over the node for that month
|


