The Server dashboard

The Server dashboard gives you the ability to monitor and configure all nodes in a cluster.

For more information about nodes and clusters, see Clustering ListManager.

The Server dashboard shows all nodes and services and the status of each, as shown in the following illustration:
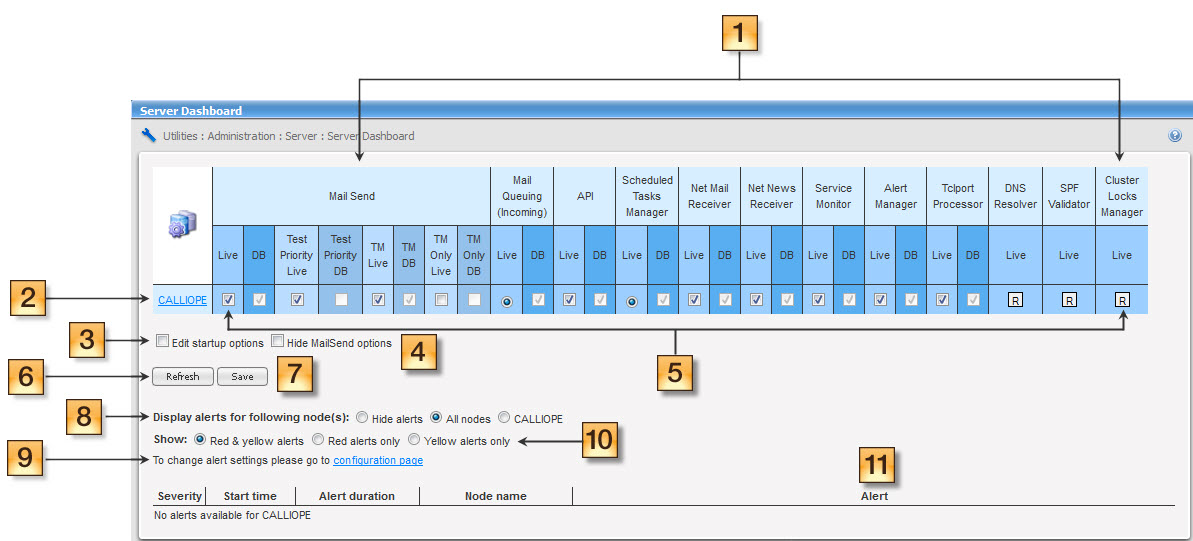
Server Dashboard UI

The table below shows the Server dashboard elements as annotated in the image above:

Annotation Label Description
List of all services
  • The Live column for each service shows the current state of the service. Services that must always be running on every node, such as DNS Resolver, show only the Live column.
  • Services that you can turn on/off show an additional column, DB.
  • The DB column specifies the service startup option. For example, in the illustration above, the API DB checkbox in not selected. This means that the API service is not going to run when the server starts.
  • If a service has multiple options that you can turn on/off individually, such as the Mail Send service, the Server dashboard shows a Live and DB column for each option, for example, Test Priority.
List of all nodes Click the name of a node to see all services and the current state of each service. For more information, see Utilities > Debug Facilities > Services
Edit startup options Select this checkbox to specify the service startup options. When you select this option, you can edit the settings in the DB column.
Hide MailSend options

Select this checkbox to hide the Test Priority and TM columns of the Mail Send service. You might want to do this to save screen space.

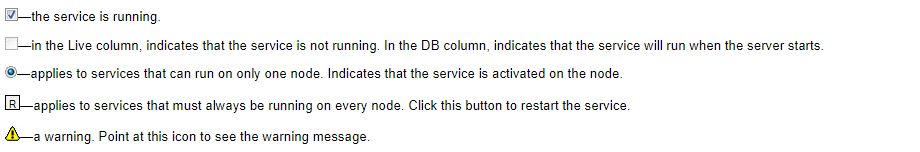
Status of all services

Indicates the status of the service:

Refresh Click this button to update the Server dashboard
Save Click this button to save your settings.
Display alerts for the following node(s)

This specifies the nodes for which to display alerts:

  • Hide Alerts: does not show alerts for any nodes.
  • All nodes: shows alerts for all nodes.
  • <Node name>: shows alerts only for the selected nodes.
Show alerts

The types of alerts to show are below:

  • Red and yellow alerts
  • Red alerts only
  • Yellow alerts only

To show alerts, you must enable them on the Utilities > Administration > Server > Server Settings > Alert Settings page.

Link to alert settings page
  • This gives you the ability to change the server alert settings.
  • For information about setting alerts, see Utilities > Administration > Server > Server Settings > Alert Settings
Alert log
  • This shows the history of alerts that the server creates when resource levels exceed your configured thresholds.
  • To show alerts, you must enable them on the Utilities > Administration > Server > Server Settings > Alert Setting's page.
  • The types of alerts in the logs are below:
  • Severity alert: the severity of the alert, green, yellow or red.
  • Green alerts indicate that a yellow or red alert has been corrected and does not exist anymore.
  • Yellow alerts indicate a warning.
  • Red alerts indicate a potentially critical server condition that might require action.
  • Start time: This is the time when the alert was raised.
  • Alert duration: This is the length of time that the condition has existed.
  • Node name: This is the name of the node where the condition exists.
  • Alert: This is the description of the condition.
  • In addition to the description, the Alert column shows the Alert id in the following format: <Node ID>-<Condition Code>-<Alert Number>

Refer to the following topic for more information: