Charts Essentials settings tab
This tab has the basics required to create a new custom chart.
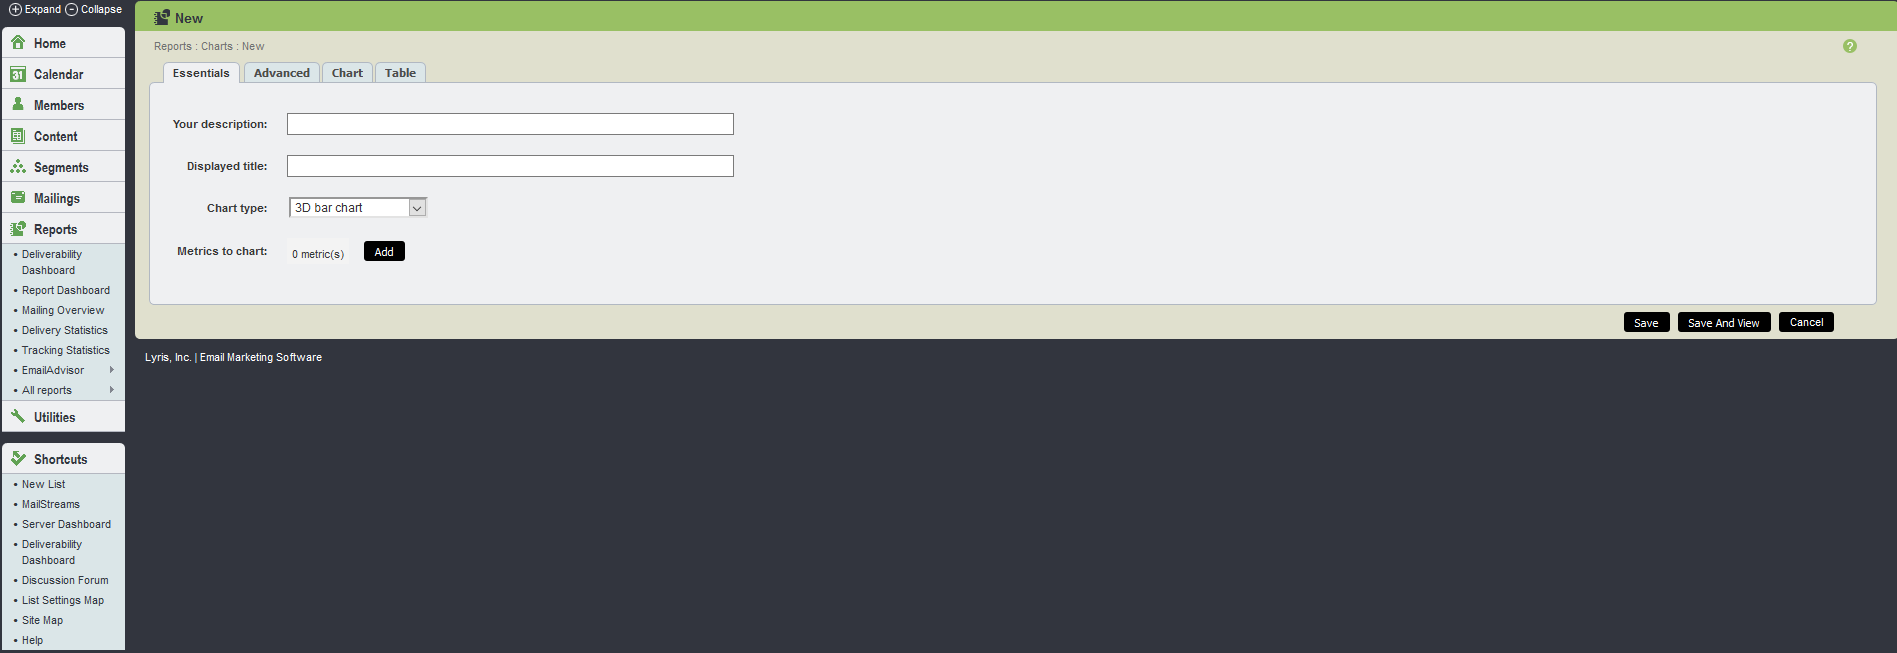
Charts Essential tab UI
The table below explains the fields available on the Essentials tab:
| Field Name | Description |
|---|---|
| Your Description |
This is your description of this chart. |
|
Displayed Title |
The title displayed on your chart. |
|
Chart Type |
The type of chart you want to create. The options are:
Note Not all chart types make sense for all kinds of data. For example, transient or permanent failure data over time cannot display properly for a pie chart. |
|
Metrics to Chart |
This displays hat statistics should be included in this chart. Click on Add to add metrics to this chart. |
Refer to the following topics for more information: